2025 saw a healthy 4% growth year-over-year with a total of 118,743 (includes institutions) of the faithful attending Mass on average each Sunday. Another encouraging indicator is that all deaneries experienced positive growth in Mass attendance; the increase in Mass attendance was not localized to one or a few regional locations. Five years of consistent increase is a strong and encouraging indicator of a stable pandemic recovery and increasing spiritual health of the archdiocese. Specific Mass counts are certainly linked to local situations which can vary from Family to Family, but even at the local level many are seeing great strides forward.
(Family counts (+/-) also reflect any college and special community church Mass counts that have been included within these Families boundaries since the beginning of Beacons of Light. Often these communities are not obvious as part of the Family but have been included each year since they are within the boundaries. Some Family total counts maybe impacted by these locations and the downloadable data spreadsheet can provide details of these impacts and the totals for each parish.)
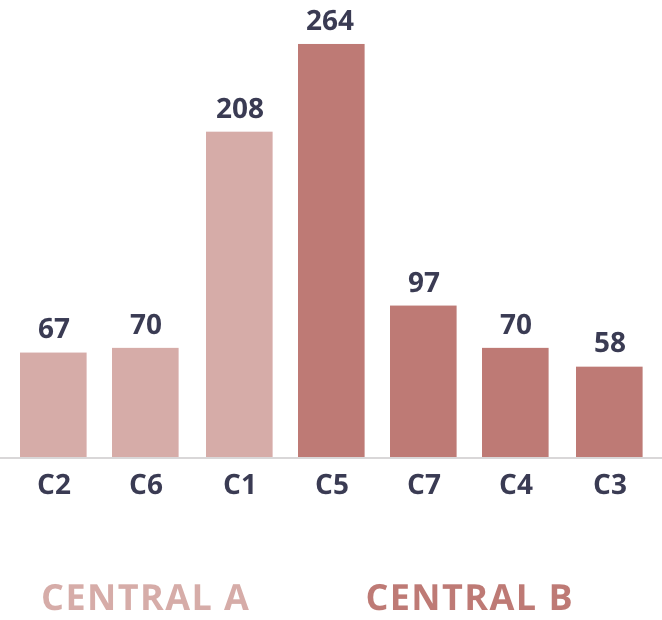
St. Joseph
67
70
208
264
97
70
28
C2
C6
C1
C5
C7
C4
C3
CENTRAL A
CENTRAL B
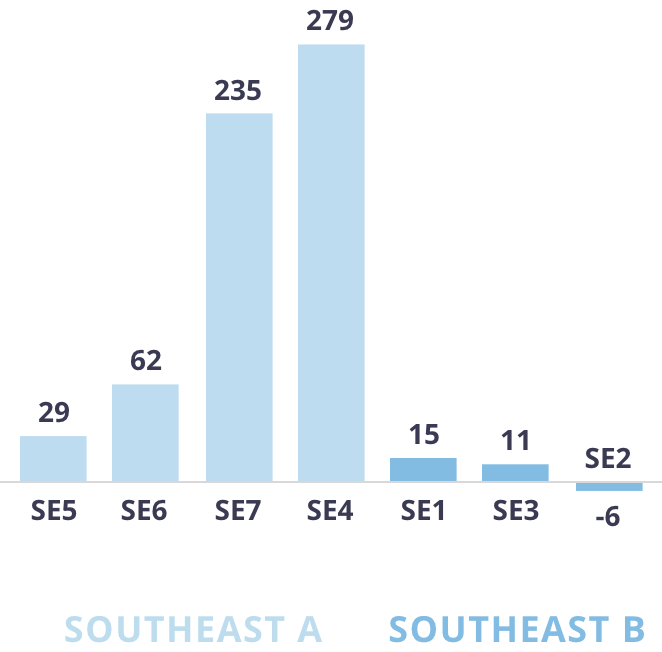
St. Mary
29
62
235
279
111
15
SE2
-6
SE5
SE6
SE7
SE4
SE3
SE1
Southeast A
Southeast B
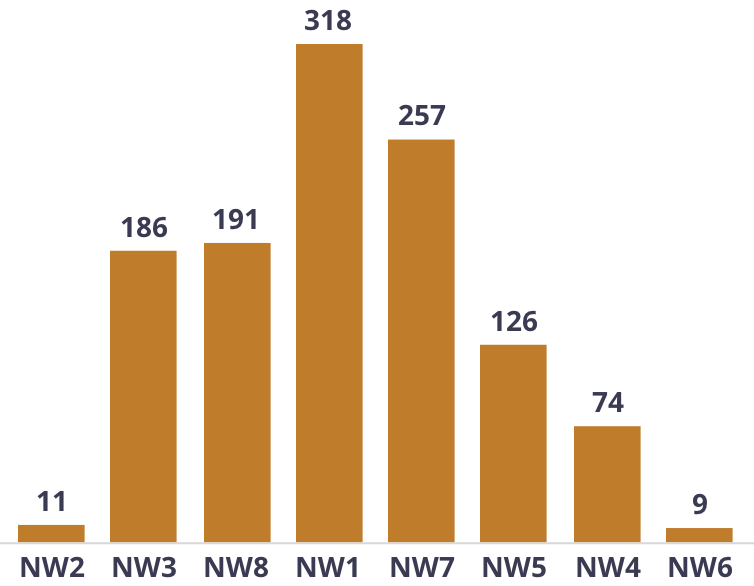
St. Augustine
111
186
191
318
257
126
74
9
NW2
NW3
NW8
NW1
NW7
NW5
NW4
NW6
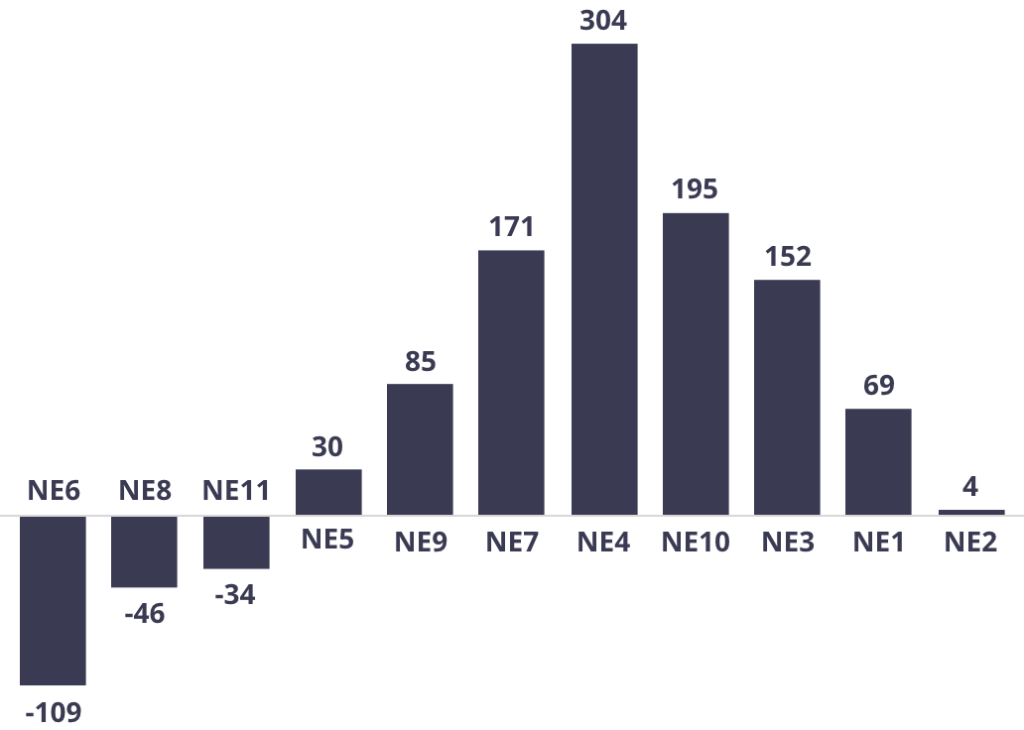
Emmanuel
NE6
-109
NE8
-46
NE11
-34
30
85
171
304
195
152
69
4
NE5
NE9
NE7
NE4
NE10
NE3
NE1
NE2
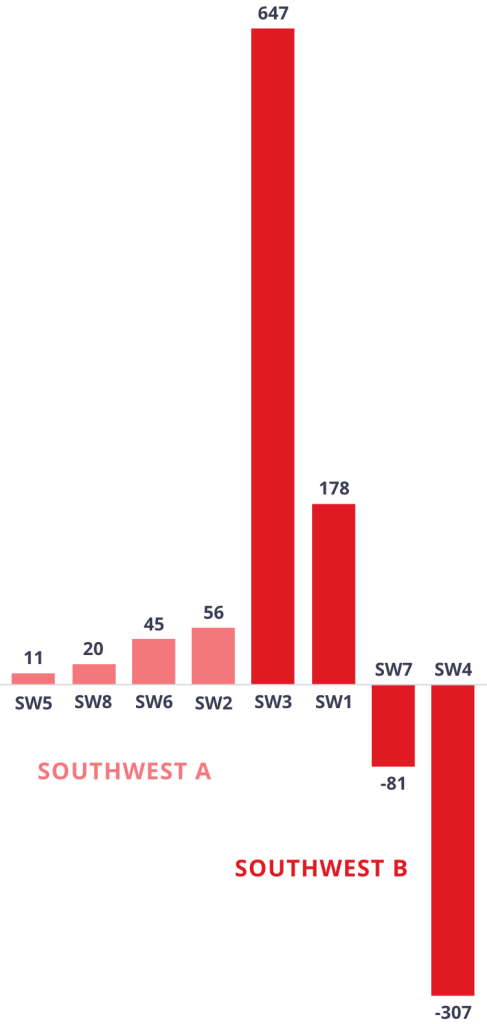
St. James
11
20
45
56
647
178
SW7
-81
SW4
-307
SW5
SW8
SW6
SW2
SW3
SW1
SOUTHWEST A
SOUTHWEST B
Cathedral
S5
-308
S14
-244
S12
-193
19
28
117
226
494
238
193
164
113
38
33
29
S1
-277
S16
S7
S4
S10
S15
S2
S3
S8
S13
S6
S11
S9
Family Recovery
14 of our Families have recovered and exceeded their 2019 Mass counts, and growth for many Families is clear. While the remaining 43 Families still have not yet returned to 2019 numbers, the year-over-year data shows that 86% of all Families are steadily increasing in counts annually.
We continue to report mostly at the Family level rather than primarily focusing on the parish/church given the recognized pressure of Mass schedule times on parishioners and their choices on where to attend Mass. This fact alone can cause one or another parish within a Family to see changes in Mass counts and utilization that isn’t indicative of the overall health of the Family nor reflect the continued good faith work of the Pastors and Families to assure parishioners have Mass time options that meet the overall needs of their parishioners. As our Families continue to move toward unification focusing our attention on the overall health and vitality of the Family will be preeminent.
Families of Parishes are showing a positive change year-over-year toward growth at a steady state. The graph below shows consistent increases in the number of Families experiencing growth and/or stabilization of their Mass counts demonstrating clear movement away from declining numbers annually. This suggests that over the next 3 years, with regular growth between 3-4%, we could begin to exceed pre-pandemic counts. This is an indication of a significant change in the life and vitality of the archdiocese which prior to COVID saw a regular annual decline of 2-3% and mimics what we are also seeing nationally.
Family Recovery
2022
2022
7
2023
2023
10
2024
2024
8
2025
2025
1
4
27
23
34
13
41
8
41
11
Schedule Changes
After reducing the number of Sunday Masses across the archdiocese by 128 since 2019 we continue to see a steady increase in Mass attendance. One factor that could both negatively and positively impact Mass attendance is changes to the number of Masses for the Sunday obligation a Family of Parishes. The parameters of Beacons of Light define how many Masses Church law allows each priest to celebrate daily and how to calibrate the number of Masses offered in a church based on utilization of seating. These parameters exist not only to guard against over-extending our priests, but also to result in church buildings that are at least half-full for any given Sunday Mass, fostering greater participation. Since 2021, there has been a reduction of 107 Masses and an increase in Mass count of 19,030. So, we can suggest that proper Mass scheduling that improves priest and community participation has benefited the Families and archdiocese.
parameter
4
The regular Mass schedule for a Family of Parishes may not assume more than two Masses per day per priest.
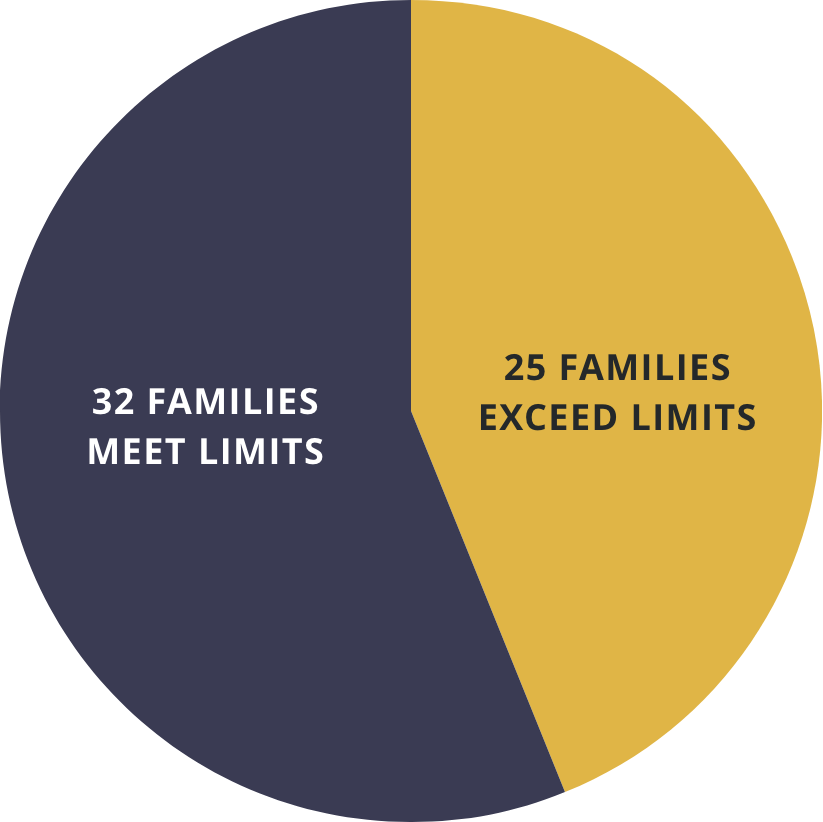
We continue to see opportunity in improving our ratio of priests to Mass times across the archdiocese. This is certainly improving year-over-year, however, 25 of our Families exceed archdiocesan policy by one or more Mass times while 32 Families have met the expectation of no more than three Masses per weekend per assigned priest. Some of those Families exceeding may be relying on support from retired priests to maintain their schedules but this is not a healthy situation and one that can easily result in active priests taking on more Masses when retired priests are sick or not available.
Family Priest to Mass Schedule Ratio
32 Families Meet Limits
25 Families Exceed Limits
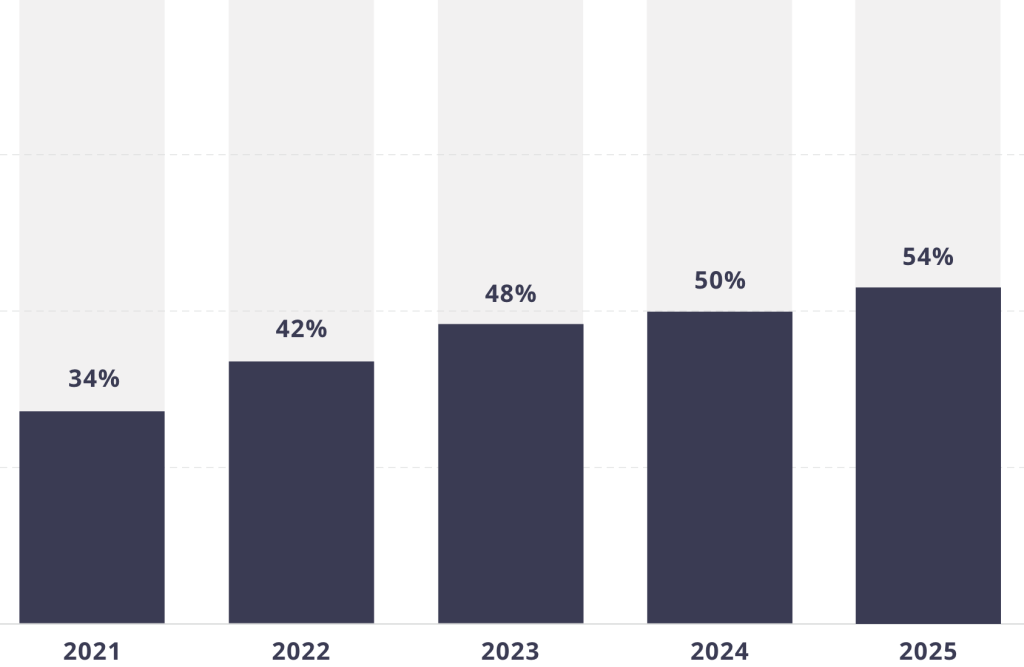
Church Utilization
In 2025 we have an overall average across all churches of 54% utilization, up 20% from 2021 a very positive and encouraging statistic. From 2024 to 2025, 32% (64) of our churches improved their utilization for Sunday Masses by at least 5%. This means that churches are fuller, meaning more vibrant liturgical celebrations and a better use of human and physical resources is increasingly normative. In some cases, the increased utilization results from simply reporting capacity more accurately to an archdiocesan standard of 27” per person. (This is an important reason to insure all churches have reported current and accurate seating capacity numbers.) Whereas many Families with smaller church capacities have adjusted their Sunday Mass schedule to reach an appropriate level of utilization and can’t reduce Masses further, many Families with larger seating capacities have further work to do in this regard. Encouragingly, since this year has seen less Mass schedule changes, utilization improvements is strongly attributed to true Mass attendance growth.
parameter
5
A regularly scheduled Mass for the Sunday precept must have annual average attendance of at least 50% of the church capacity.
Average Archdiocese Church Utilization
0%
0%
0%
0%
0%
2021
2022
2023
2024
2025
Growth in utilization scores also indicates that our churches are working on appropriate changes year-to-year as we can clearly see with scores moving each year towards and beyond the 50% utilization expectation. Our priests and parishes should be recognized for all their work.
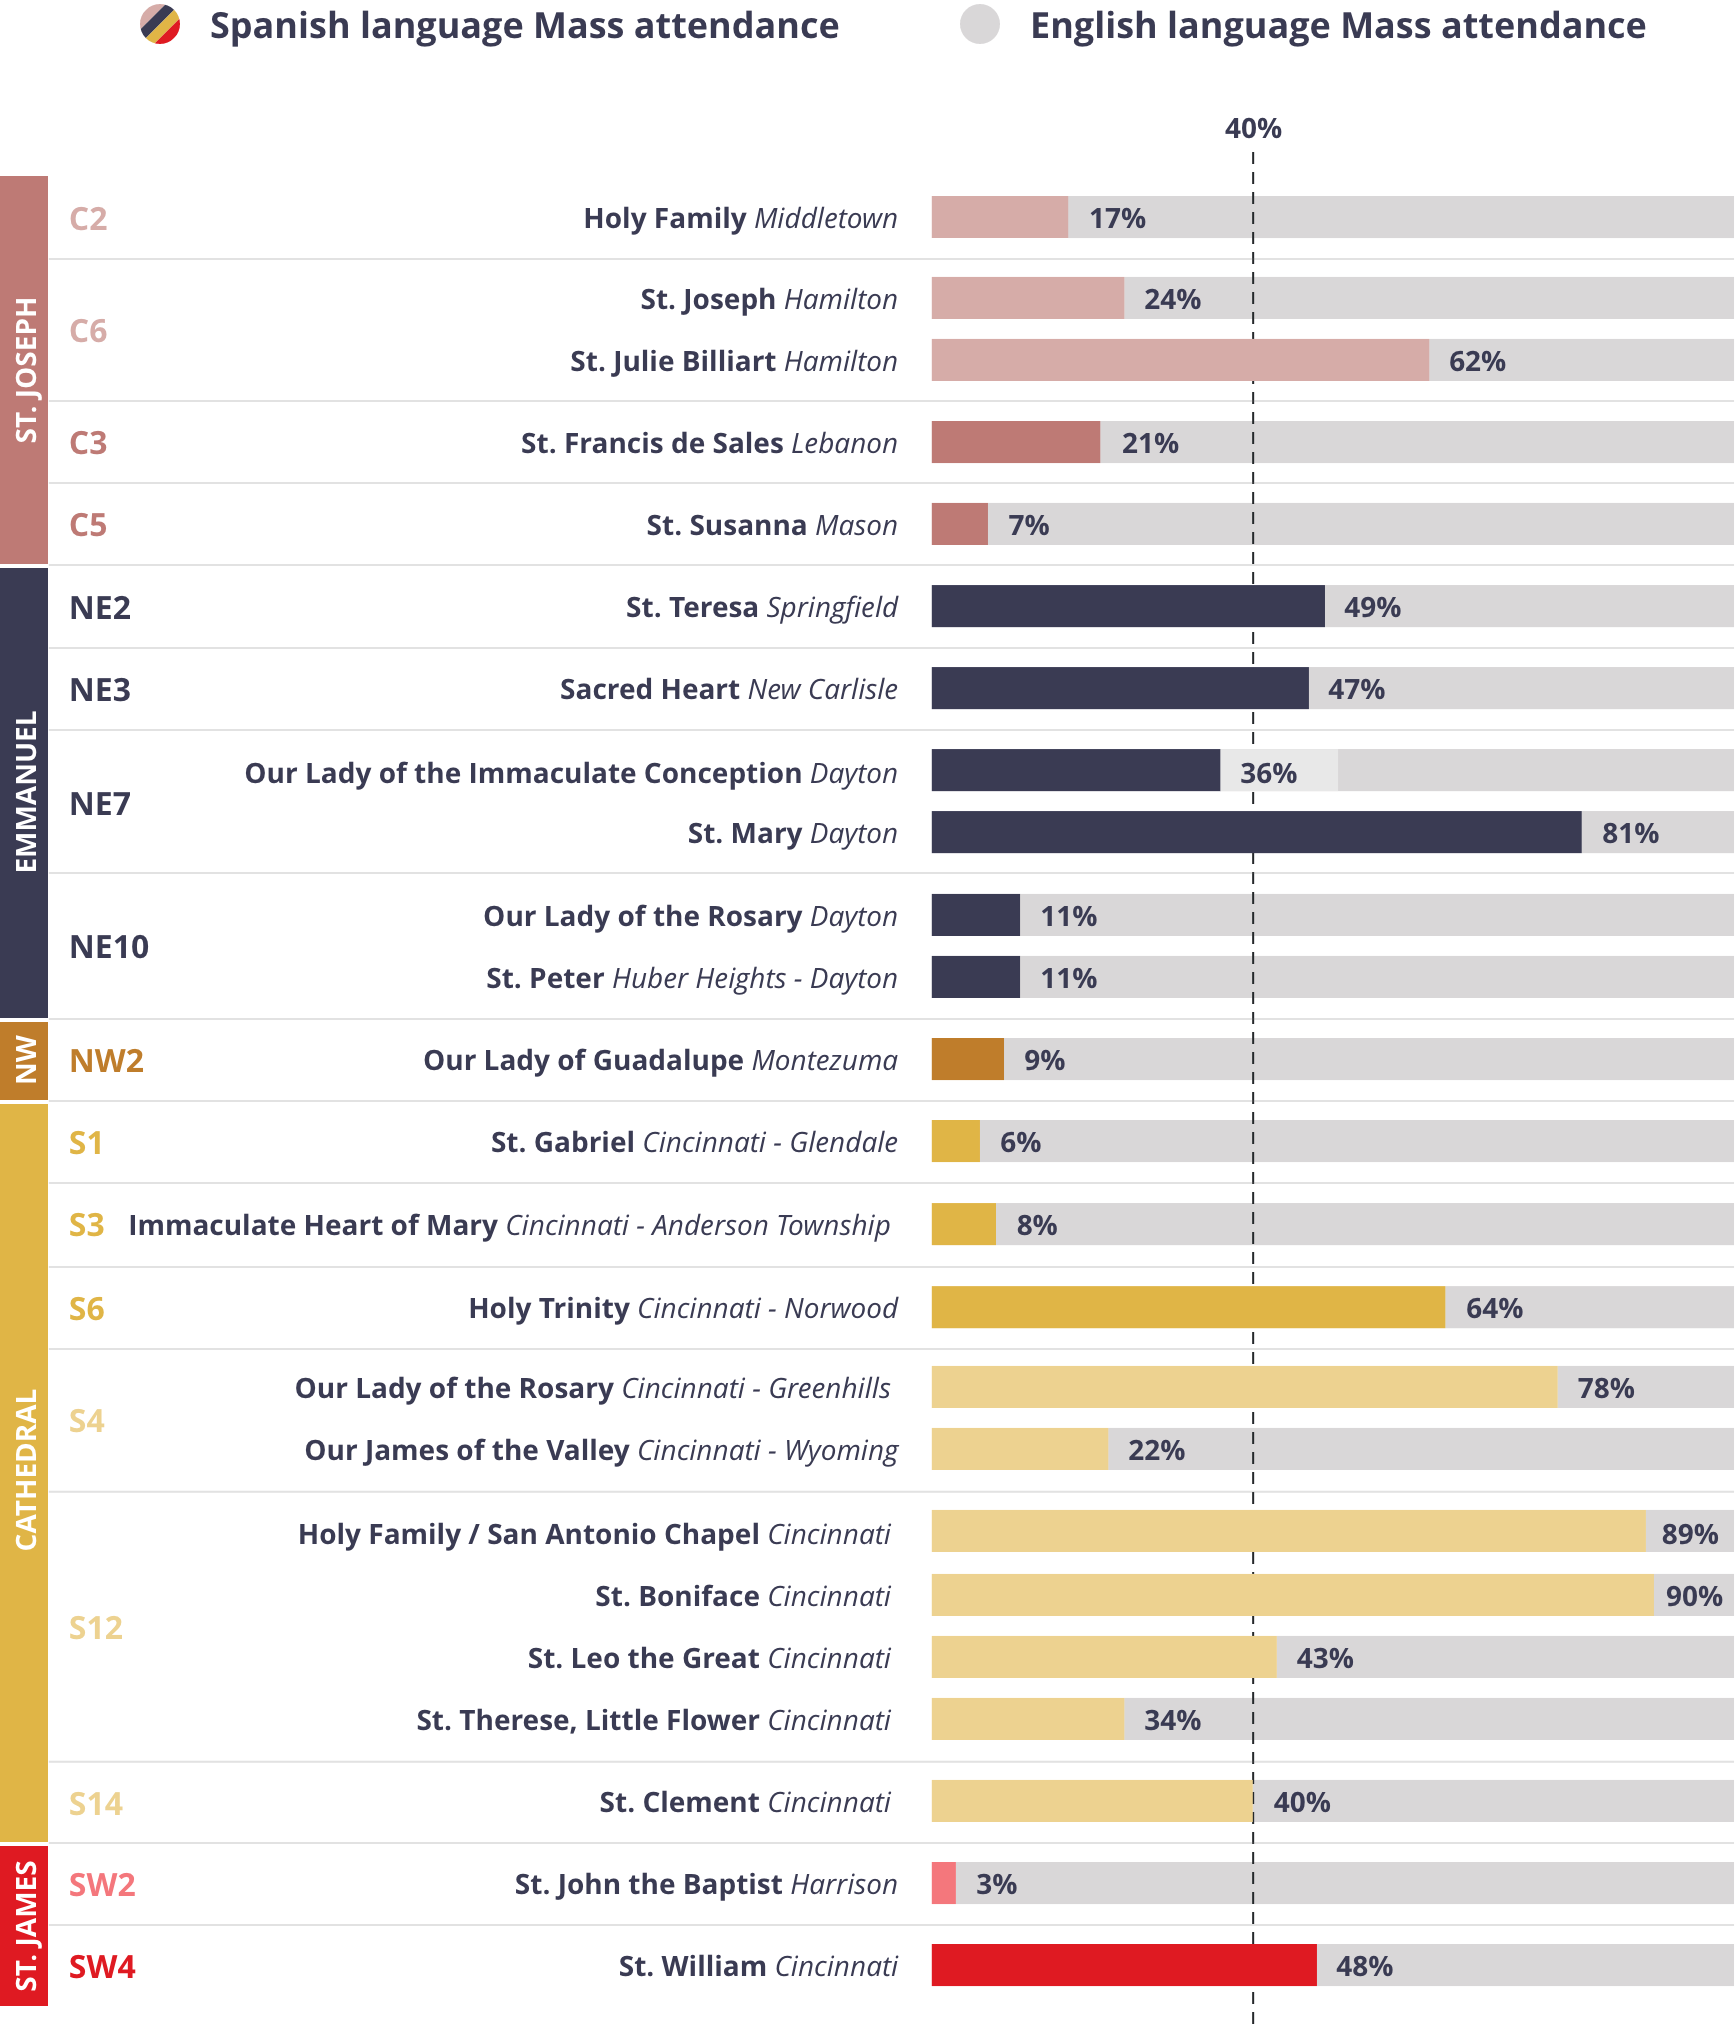
Mass Languages
This year we started tracking what language in which each Sunday Mass was celebrated. Currently we have 17 Families reporting that they celebrate Mass in Spanish at some point on Sunday. A very few other Sunday Masses are celebrated in a language other than English or Spanish. 17 Families (24 churches) currently celebrate Sunday Mass in Spanish, with 7004 people attending Mass in Spanish each weekend. In 13 of these churches the attendance reported for the Spanish Masses represents 40% or more of the overall churches average weekend Mass counts.
Percentage of Spanish language mass attendance compared to total AVERAGE mass attendance
National Changes
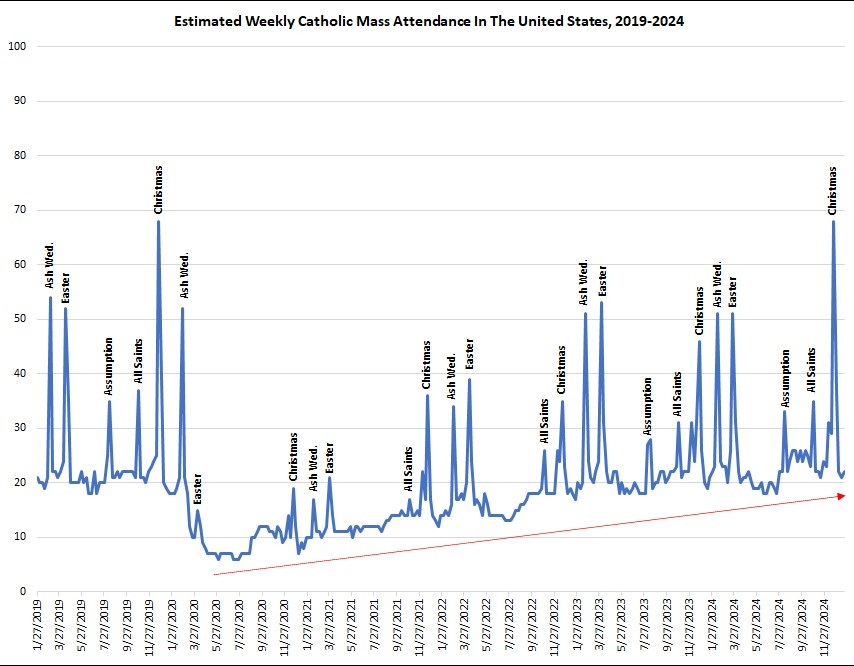
Mass attendance continues to show improvement nationally. Christmas in 2024 was the first time Mass attendance for this feast day reached its 2019 level. Easter and Ash Wednesday Mass attendance had also returned to pre-pandemic levels by 2023. Interestingly, it should be anticipated that locally we may experience momentary drops and returns in weekly Mass counts as we can see from the national chart below. These should not be immediately seen as an indicator of possible future decline. Counts will hopefully rise as we move forward.
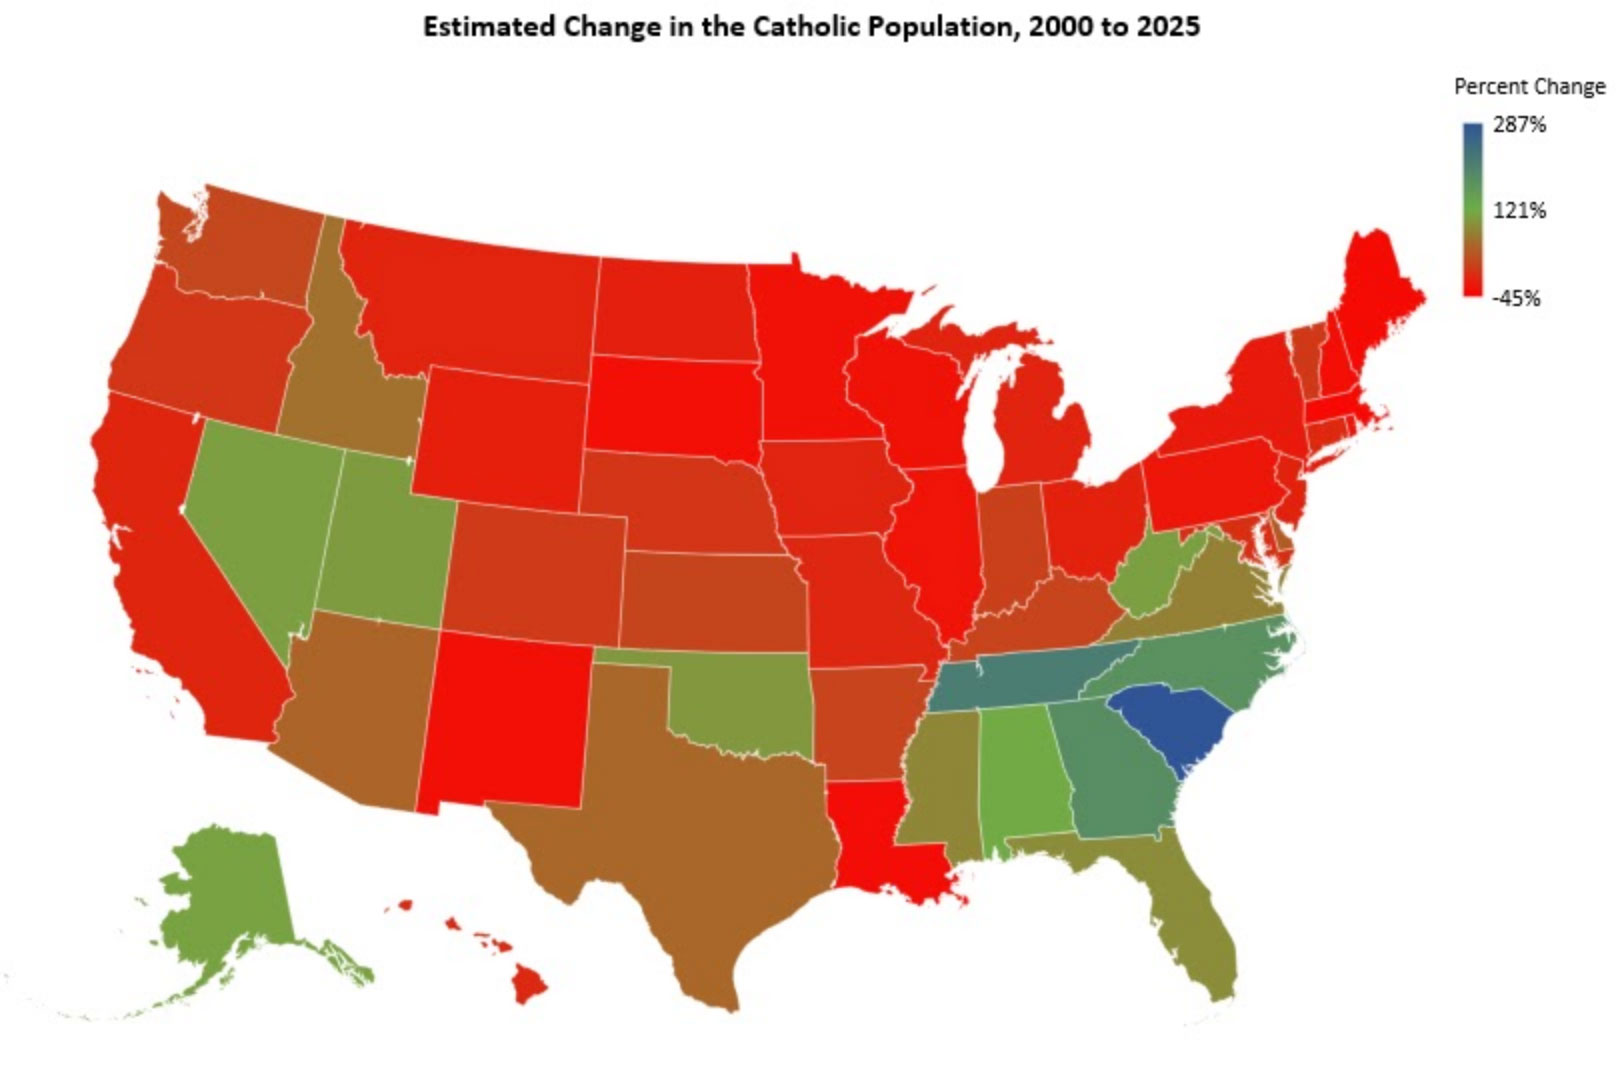
Regarding national population movement and its influence on Mass counts, two states stand out in recent years: Texas and Florida. On a regional level, the South has experienced a net gain of more than 7.4 million Catholics from 2000 to 2025. The West has seen minimal net growth adding 1 million Catholics. At the same time the Northeast lost 4.4 million Catholics and the Midwest lost 2.3 million in the last 25 years. This is all part of a broader long-term shift of the U.S. population from the “Rust Belt” of the Northeast and Midwest to the “Sun Belt” of the South. These changes have occurred during an unusual period of mobility change in the population. In 2006, the U.S. Census Bureau estimates that approximately 17% of the population moved during the year. This has steadily declined to an annual rate of about 12% in 2024.
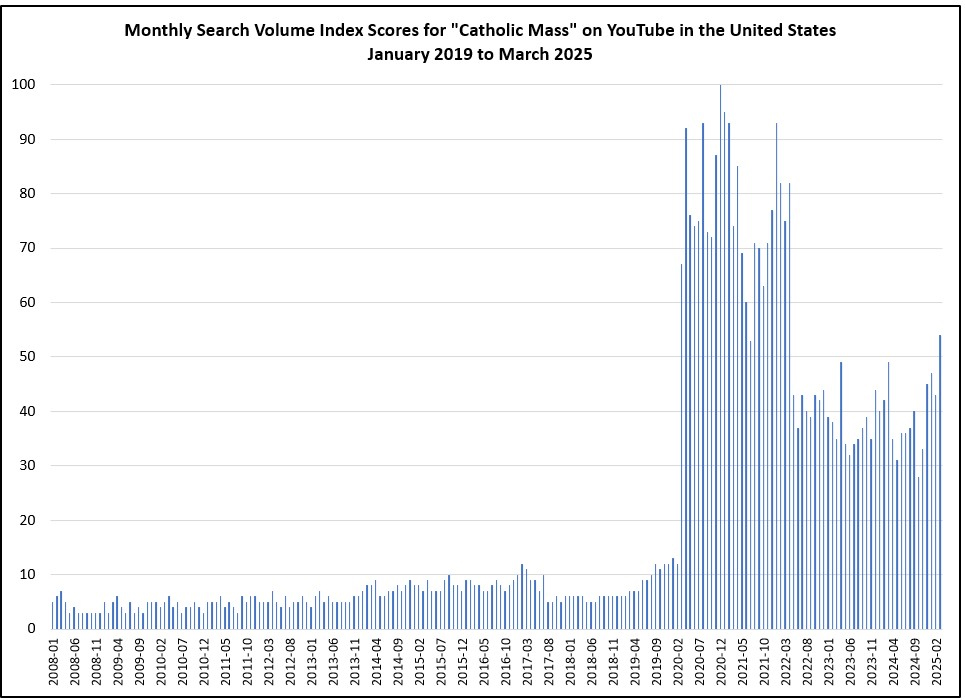
During the pandemic Google search volumes for “Catholic Mass” increased 458% from what they were in February 2020. Prior to that, volumes were much lower with most Catholics preferring to attend Mass in-person. It appears the pandemic has created a new habit. Although in-person Mass attendance has returned to pre-pandemic levels, there is still a higher demand for watching Catholic Mass online than before the pandemic. This is not as high as it was during the peak interest period from March 2020 to April 2022 but is still elevated enough to represent a significant new behavior adopted by Catholics that did not exist as broadly in the past. This should encourage us all to extend an invitation to those who we know may not have returned to Mass. That simple act of personal invitation may just make the difference for those still sitting in the isolation caused by the pandemic.